HOW IT WORKS
From notes to visual timeline
Build Patient History
Document sessions over time. Each note adds structured clinical data to the patient record.
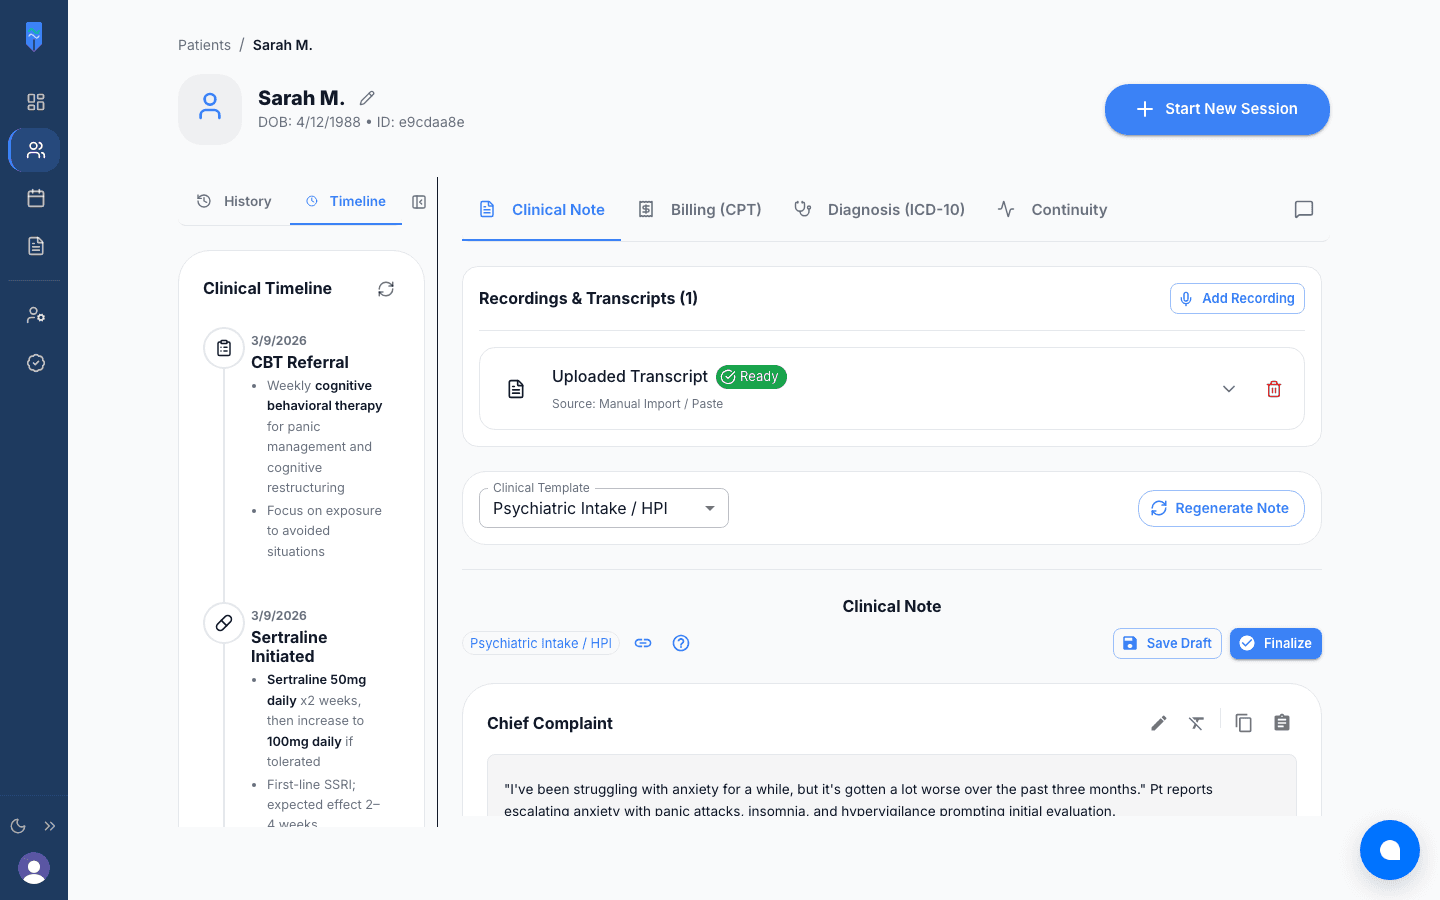
Auto-Generated Timeline
AI extracts medications, diagnoses, milestones, and outcomes to build a chronological treatment story.
Visual Treatment Story
Review an interactive timeline showing what was tried, what worked, and what changed—all at a glance.
Frequently Asked Questions
Clinical Timeline automatically extracts structured data from your session notes—medications, diagnoses, treatment decisions, and outcomes—and arranges them chronologically. No manual data entry required.
Yes. The timeline visualizes when medications were started, adjusted, or discontinued alongside symptom changes and clinical observations, making it easy to assess what has been effective.
A timeline is generated from the very first session. However, the visualization becomes more valuable with each additional session as patterns and treatment trajectories become visible.
The timeline is part of the patient record within MH Scribe. It provides an excellent summary for care coordination conversations and can inform documentation you share through your standard referral processes.